How I'm trading the bond crisis with 60 years of data
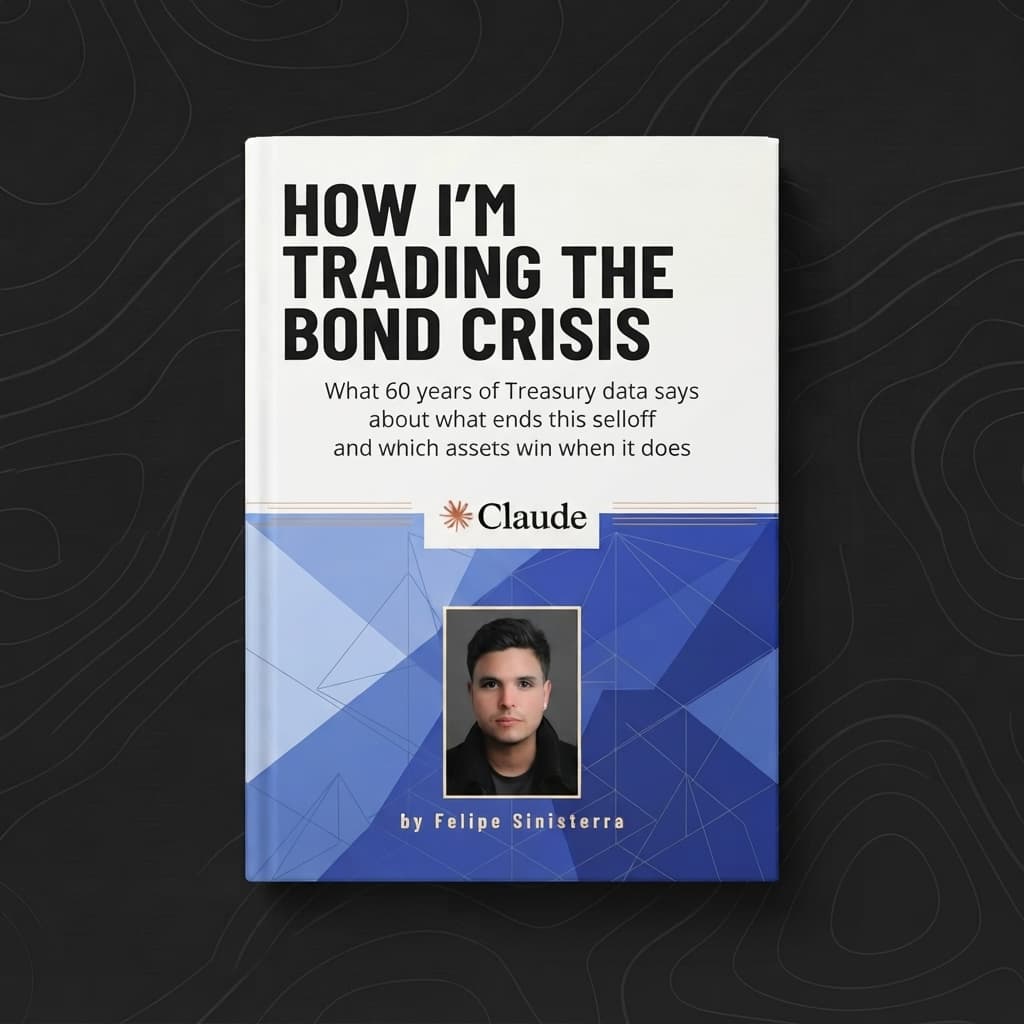
How I'm trading the bond crisis Treasuries are getting hit hard, as I'm sure you've seen. The 10-year just closed at 5.11%, its highest since 2007, and the 2-year has moved even more. It started with the Fed, which began hiking again in September only nine months after its last cut, and now the market is repricing how far it goes from here. So the question that matters for anyone running money is what ends this, and what wins when it does. This is exactly the kind of question AI is good at now. I pointed Claude Code at the raw data through APIs and MCP servers and had it put today in the context of every bond selloff since 1962. Overall, this is what I did:
It came back as a 225-page report, and seven things jumped out. 1. It's fast, and it isn't spreadingYields are moving about as fast as they ever do, but the rest of the market doesn't care. Stocks are up since February, the VIX is calm, and corporate credit spreads are near their tightest in 40 years. Every real bond panic since 1987, from the 1987 crash to the UK gilt blowup and last year's tariff shock, spilled into stocks and credit, and this one hasn't. The scariest stretch this year was actually March, during the oil shock, when our stress index ran well above where it sits today. One risk I'd still watch is hedge funds, which are still carrying a short in Treasury futures close to last year's record through the basis trade, and so far they've been unwinding it calmly. This is the market repricing the Fed while the plumbing holds, and if that changes, credit is where you'll see it first. 2. It's a Fed story, and the debt story hasn't shown up yetThe headlines want to blame deficits, but the data points at the Fed. If investors were dumping Treasuries over the debt, the 30-year would be leading. Instead the 2-year is leading, which is exactly what a Fed repricing looks like. Inflation expectations have barely moved either, since almost the entire rise is in real yields. The one real crack is the 5-year auction, where eight of the nine sales this year drew some of the weakest demand since 2009, including this week's. As for the debt, the numbers are ugly and several are at records, yet in 60 years of data the debt level has never told you how a bond selloff ends. If you're positioned for a debt crisis, the bond market isn't there yet, and the tell would be the 30-year taking over the lead. 3. History says the Fed decides the endingI had Claude Code find the 15 moments in history that look most like today, matched on rates, the Fed, inflation, oil and stocks. The single closest match was February 2000, and June 2007 is on the list too, which means the two setups before the dot-com bust and the financial crisis both look like today. What jumped out was the Fed, because in every one of those setups where the Fed ended up cutting, the 10-year rallied hard, and in the ones where it didn't cut, it was a coin flip. Right now the market is pricing no cuts at all, just more hikes. The single most important thing to watch is whether the Fed blinks, because that is the one thing that split this history cleanly. 4. Selloffs rarely end with a Fed pivotEveryone is waiting for the Fed to pivot, but only one of the 48 bond selloffs since 1962 actually ended that way, back in 1974. The most common ending was no clear trigger at all, where yields simply stopped going up, and growth scares came next. Famous selloffs ended in very different ways: the 1994 bond massacre ended when the Fed hiked 75bp in one go and the market decided it had done enough, and the 2018 selloff ended in a growth scare as stocks rolled over into December. The most useful example is the last time the 10-year hit 5%, in October 2023. That selloff ended when the Treasury announced it would sell fewer long bonds at its November refunding. This year's refunding lands on November 4, the same day Treasury's support for the long end runs out, so that week matters more than any Fed speech. 5. Bills beat bonds unless something breaksAt 5%, the 10-year looks attractive on its own, but the real comparison is the 1-year bill. The 10-year only beats the bill over the next year if yields hold or fall from here. If the Fed keeps hiking and the curve keeps flattening, bills beat every Treasury on the curve. If something breaks and the Fed cuts, the 10-year makes double-digit returns. The 2-year sits in between, since it can absorb a far bigger rise in yields than the 10-year before it loses money. Owning long bonds here is a bet that something breaks, while owning bills is getting paid to wait. 6. Your bonds stopped hedging your stocksThe old playbook was simple: when stocks fell, bonds rallied and cushioned the portfolio. That hasn't worked since 2022, because stocks and bonds have been moving together, and on the worst days for stocks the 10-year has basically done nothing. This year the culprit is oil, since war escalations kept sending stocks down and yields up at the same time. The dollar has been the better shock absorber whenever stocks and bonds move together. If your downside hedge is long bonds, check whether it still works in a market where oil is driving both sides. 7. What wins in each endingHere's how the major assets did in past years that played out each way:
Gold is the interesting one, because it has had a brutal run so far, down about 18% since February and worse than in any past bond selloff at this stage, yet it made money in every one of these endings without ever being the top performer. The asset that wins the scenario everyone fears is long bonds, and the asset that wins the scenario the market is pricing is oil. How I'm trading itMy base case is the one the market is pricing, where the Fed keeps hiking and the front end keeps doing the damage. It was also the most consistent result across almost every way I cut the history, and traders give the Fed almost no chance of cutting before December. In that world I'd rather get paid to wait in bills than stretch into long bonds, because bills win when the curve flattens. Oil is the asset that has worked best in that setup, and stocks have held up fine through it. For protection I'm not leaning on long bonds, since the dollar has done that job better in markets where stocks and bonds move together. What would flip me is credit, because if spreads blow out and the Fed has to cut, long bonds go from a laggard to the best asset on the board, and that's when I'd want to own duration. What I'm watching
Strip out the noise and this selloff comes down to one question, which is how far the Fed goes, and everything else is a sideshow until that's settled. The full 225-page report is here if you want the details: Through Five Percent Treasury Selloff If there's a macro question you want me to point Claude Code at next, hit reply. I read everything. Talk soon, Felipe PersonalMy cofounder Dave will be hosting a free live webinar with Sarah Hoffman from the AlphaSense team! If you're curious on how to get the most out of these AI tools for real workflows, we'll be discussing this live. October 15th .... see you there!
|
Enjoyed this article?
Get more AI for finance content delivered to your inbox.